Cities around the world are expanding at a breakneck pace. This global urbanisation trend is primarily driven by population growth and migration. It presents a massive challenge to local governments to ensure these ever-growing cities are inclusive, safe, resilient, and sustainable. This goal, enshrined in the United Nations Sustainable Development Goal 11 (SDG 11), requires an understanding of one of the most fundamental characteristics of a city: its density.
In Delhi, one of the world's fastest-growing megacities, the challenge is particularly complex because its urban structure defies conventional models. Instead of the highest population density being concentrated in the historical core, Delhi exhibits a phenomenon researchers call an inverted compact form, where the densest, most congested areas are often found in the peripheral, unplanned zones. This unique and uneven distribution of people and buildings creates a complex mosaic of neighbourhoods, each with its own distinct set of challenges and opportunities for human well-being.
A new collaborative study by an international team from Hokkaido University, Japan; Chennai Institute of Technology, Chennai; University of the West of Scotland, UK; Indian Society for Applied Research and Development, New Delhi; TERI School of Advanced Studies, New Delhi; and others has investigated the urban complexity of Delhi. Their study reveals that the impact of Built-up Population Density (BUD) on human well-being is a complex interaction.
Did You Know? Delhi and the satellite cities of Gurgaon, Noida, Greater Noida, Ghaziabad, Faridabad, and YEIDA City, located in an area known as the National Capital Region (NCR), have an estimated population of over 28 million, making it the largest metropolitan area in India and the second-largest in the world (after Tokyo). |
The researchers employed a novel micro-scale analysis that integrated multiple data sources. They combined high-resolution ward-level socio-economic data from the 2011 Census of India with environmental variables extracted from remote sensing imagery, specifically Landsat 8 and Google Earth. The environmental variables included built-up area, surface imperviousness, land surface temperature, and per capita green spaces. Using spatial analysis software like ArcGIS Pro, they mapped the Built-up Population Density (BUD) and identified spatial clusters.
Finally, correlation analysis was used to quantify the statistical relationships between BUD and the various well-being capitals, which they defined as a collective term for infrastructure access, environmental quality, and economic opportunity. The quantitative findings were further validated through on-site field observations in the most extreme clusters, confirming the statistical results in lived urban conditions.
The researchers found that density across Delhi varies dramatically, ranging from a sparse 2,884 persons per square kilometre in some rural-like clusters to an extreme 136,385 persons per square kilometre in the most congested, age-old neighbourhoods. This extreme variation is the root of significant socio-economic inequalities. The study categorised Delhi into six distinct clusters, each representing a different density regime and urban form. For instance, Cluster 1, located in South-West Delhi, is predominantly rural, characterised by low density and abundant green space. However, it struggles with limited access to piped water and relies heavily on bicycles for transportation.
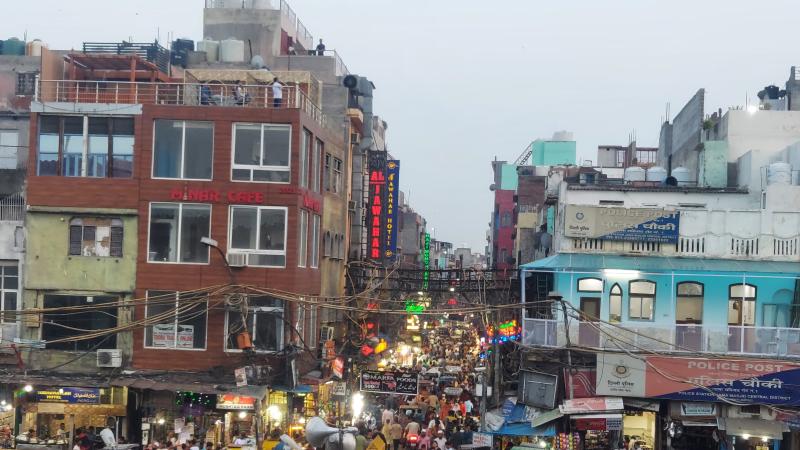
In stark contrast, Cluster 6, which encompasses the Ajmeri Gate area of Old Delhi, is the most densely populated, characterised by unplanned, congested informal settlements. Despite its central location, this cluster suffers from the lowest per capita green space, the lowest groundwater level, and the lowest work participation rate, highlighting a severe strain on resources and amenities.
The study shows that, while BUD significantly affects well-being outcomes, its positive influence diminishes beyond a certain optimal threshold. In the highest-density, unplanned areas, the socio-economic conditions, such as access to infrastructure, economic opportunity, and environmental quality, become equally, if not more, influential than density. High density in these areas does not translate to better services; instead, it leads to overcrowding, over-utilisation of infrastructure, and a consequential strain on urban services.
For instance, the high-density, unplanned settlements of Ajmeri Gate (Cluster-6) suffer from significantly poorer access to basic services and amenities. These areas have the lowest per capita green space (a mere 0.35 m² per person, far below the UN's recommended minimum of 30 m²), the lowest groundwater levels, and a high environmental cost due to intense, unregulated densification. Conversely, planned, medium-high-density areas like Pitampura (Cluster-4) boast the highest access to piped water and car ownership, suggesting superior living standards are tied more to planning and infrastructure than to density alone.
Furthermore, the study revealed alarming environmental costs associated with this unplanned densification. The city has a high average impervious surface ratio of 61%, meaning a significant portion of the land is covered in materials like concrete and pavement that prevent natural water infiltration. This contributes to a higher risk of flooding and exacerbates water scarcity due to lower groundwater recharge. The unequal distribution of green spaces also intensifies the Urban Heat Island (UHI) effect, making densely populated wards hotter and less livable.
However, the researchers acknowledge that the reliance on ward-level census data, while providing broad insights, may not capture the detailed variations within a ward. Furthermore, the study used correlational analysis, which can identify patterns and links but cannot establish definitive cause-and-effect relationships. Finally, the socio-economic data used was from the 2011 census, introducing a temporal lag that may not fully reflect the current, rapidly evolving urban reality.
The findings, nonetheless, provide a valuable lens for urban policy and planning in rapidly growing global cities, especially those in the developing world. By emphasising the spatial heterogeneity of urban density, the study offers a policy framework for differentiated planning strategies that can directly benefit society today. By tailoring urban planning policies to the specific challenges of each neighbourhood cluster, this work provides a data-informed pathway toward achieving the SDG 11 goal of creating more inclusive, safe, resilient, and sustainable cities.
This article was written with the help of generative AI and edited by an editor at Research Matters.


