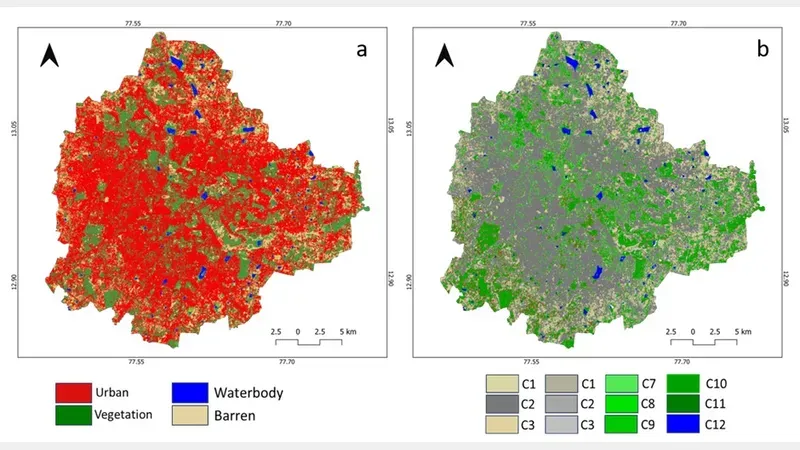
Land use classification for Bengaluru (a) land uses based on classification of Sentinel data (10 m resolution), (b) the proportion of LU in 30 x 30 m pixels (based on LU of 10 x 10 m Sentinel). Source: Ramachandra et. al, 2025.
Projections suggest that by 2050, 68.4% of the global population or more than two-thirds of all people, will call urban areas home. This massive shift, often driven by economic opportunities and the allure of modern amenities, has been happening for centuries, tracing its roots back to ancient river valley civilisations. But as our cities expand and grow outwards they're heating up. This phenomenon, known as the Urban Heat Island (UHI) effect, is becoming an increasingly pressing issue, turning our bustling metropolises into literal hot spots.
A recent study from Indian Institute of Science (IISc), Bengaluru, Indian Institute of Technology (IIT), Kharagpur, and Alva’s Institute of Engineering and Technology, Moodbidri, has studied this effect, focusing on Bengaluru, the Silicon Valley of India. The study, published in Scientific Reports, led by Dr T. V. Ramachandra from IISc, analyses this warming trend, revealing how the very fabric of our urban landscapes contributes to rising temperatures and what we can do about it.
Did You Know? Cities are natural ovens! The Urban Heat Island (UHI) effect can make cities feel several degrees Celsius hotter than the surrounding countryside, especially at night. This is because concrete and asphalt capture more heat from the sun than natural landscapes and radiates back at night. |
The team embarked on a detailed investigation to understand the complex relationship between how a city is built and the temperatures experienced within it. They wanted to know what was happening on a micro-level scale, rather than just looking at broad city-wide trends. They employed remote sensing data, essentially using data from satellites as their eyes in the sky. They utilised data from Landsat 8 satellites, which provide thermal information at a resolution of 30 meters, and Sentinel-2 satellites, offering optical data at an even finer 10-meter resolution. This combination allowed them to get a highly detailed picture of both land use and surface temperature.
They tracked changes in land use and land cover over five decades, from 1973 to 2025. To do this, they calculated various spectral indices, which are mathematical formulas that combine different light wavelengths reflected from the Earth's surface. For example, the Normalised Difference Vegetation Index (NDVI) helps identify how much green vegetation is present, while the Normalised Difference Built-up Index (NDBI) highlights paved or built-up areas. The Modified Normalised Difference Water Index (MNDWI) pinpoints water bodies, and the Bare Soil Index (BSI) reveals exposed earth.
By analysing these indices, they could see the expansion of concrete and the shrinking of green and blue spaces. The Land Surface Temperature (LST) was then calculated from the thermal data, showing the actual temperature of the ground. To quantify the UHI effect and assess environmental comfort, they used a metric called the Urban Thermal Field Variance Index (UTFVI). They also used a machine learning technique called Random Forest to classify different land uses with high accuracy.
The study confirmed the largely anecdotal evidence presented for the rising temperatures in the city. It shows that as natural (pervious) surfaces like green spaces and water bodies are replaced by impervious ones like concrete, asphalt, and buildings, the city's ability to regulate its temperature plummets, leading to a significant increase in heat. Through statistical analysis, the study confirms that built-up and bare land areas are strongly linked to higher temperatures and vegetation and water bodies act as crucial heat sinks, actively cooling the environment.
Bengaluru, the study shows, saw a staggering 1078% increase in built-up areas between 1973 and 2025, while vital elements like vegetation and water bodies saw dramatic declines. This transformation has turned vast swathes of the city into heat traps, with some areas reaching as high as 48°C, while cooler spots, often near water or dense greenery, hovered around 29.86°C. The average temperature across the city was a noticeable 38.61°C. Alarmingly, the study identified 15.41 square kilometres as hot spots experiencing very high temperatures. It also found that a significant 76% of the city suffers from unfavourable ecological conditions due to this enhanced thermal discomfort.
The research is the first to analyse the micro-level interactions between land use and temperature in Bengaluru. While many earlier works looked at broader patterns, this study's use of high-resolution satellite data allowed for a much more granular understanding of how different types of surfaces, even within a single city block, influence local temperatures. This detailed approach provides unprecedented insights into the complex spatial relationships in diverse urban landscapes.
However, the researchers noted the absence of in situ data, meaning direct temperature measurements taken on the ground, which would have helped validate their satellite-derived LST readings. Additionally, relying on single-date imagery means the study couldn't capture how temperatures might fluctuate over different times of day or seasons, which is crucial for a complete picture of UHI dynamics. Future research could also benefit from considering other factors like terrain elevation, wind patterns, and the socio-economic and health impacts of heat, which all play a role in how UHI affects people.
By providing data-driven insights at a highly localised level, the research empowers city planners, policymakers, and local communities to make informed decisions. It demonstrates that prioritising and protecting green spaces and water bodies isn't just about aesthetics; it's essential for creating climate-resilient urban systems that are healthy and livable. The study's recommendation that cities maintain at least 30% green cover for optimal thermal comfort is a concrete goal that can guide future development.
It also highlights the urgent need to rejuvenate existing lakes, which have dramatically declined in Bengaluru, to help moderate local climates. The research has already sparked discussions with town planning authorities, who are considering incorporating these findings into their master plans, aiming to ensure that future urban growth balances economic development with environmental sustainability and the well-being of its citizens. Ultimately, this work provides a scientific roadmap for building cooler, healthier, and more comfortable cities for everyone.
This article was written with the help of generative AI and edited by an editor at Research Matters.


