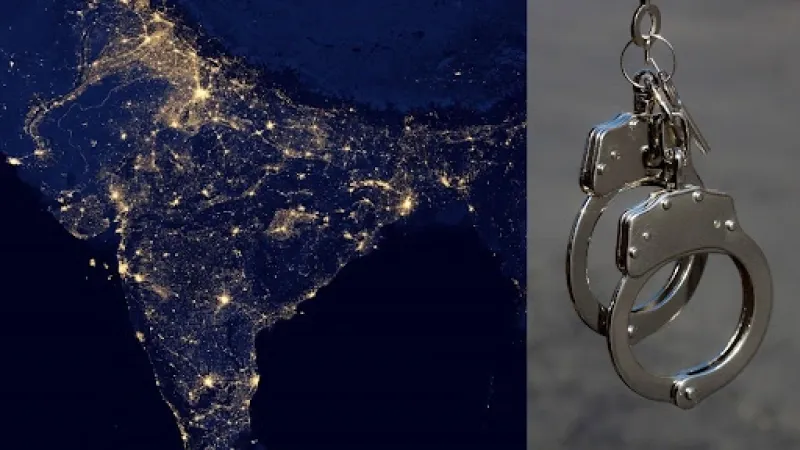
Night images from orbiting satellites or the International Space Station all show a similar pattern, a blazing city shining bright and the light gradually softening into the gentle glow of rural landscapes. Nowhere is this story more dramatic than in India, a nation undergoing rapid growth and urbanization. In just the last decade, the country's nocturnal luminosity has swelled by an incredible 43%, with some states experiencing an astounding 400% surge. These pattern of night lights in and around a city can tell analysts a lot about its economy and now, thanks to new research, even its crime rates.
In a new study, researchers from Institute of Technology (IIT) Kharagpur, and Indian Institute of Technology (IIT) Kanpur, have used a novel method to explore the connection between the glow of cities from space and the rate of inequality and crime within it.
Did you know? Decadal Change of Night Time Light over India from Space (2012-2021) report by Isro's National Remote Sensing Centre (NRSC) highlights a 43% increase in night light radiance in India between 2012 and 2021. Some states, like Bihar and Manipur, experienced growth exceeding 400%, while others like Maharashtra and Tamil Nadu saw more moderate increases. |
The study, published in PLOS One, studied the relationship between economic inequality and crime across 49 Indian cities between 2016 and 2021. Traditional ways of measuring economic differences between people in cities depend on income surveys, which can be complex and resource intense to get for every city. To simplify the process, the researchers turned to satellite data. Specifically, they used images from the Suomi National Polar-orbiting Partnership (SNPP) Visible Infrared Imaging Radiometer Suite (VIIRS) satellites. These satellites capture the light emitted by Earth at night, and the brightness of these lights can be a good indicator of economic activity.
The team used a tool called the Gini coefficient, which represents the income or wealth distribution within a population For the new study, the team applied the Gini coefficient to the nighttime light data. By looking at the variation in light intensity within cities, they could create a measure called light-based inequality. If some areas of a city are bright while others are dim, that could suggest a significant difference in economic activity, or inequality, between those areas, which is measured with light-based inequality.
The study revealed a clear link: cities with higher levels of light-based inequality tend to have higher crime rates. The researchers found that for every 1% increase in light-based inequality, there was a corresponding 0.5% increase in the total crime rate. This connection held true even when they looked at different types of crime, including violent crimes and property crimes. When there are significant economic gaps between people in a city, it appears to lead to an increase in crime. The obervation aligns with sociological theories like strain theory, which suggests that when people feel deprived of legitimate ways to achieve their goals, they might turn to crime.
The study also looked at conviction rates or the number of people found guilty of a crime compared to the total number of crimes. The researchers found that a higher conviction rate also led to a decrease in crime rates. This is possibly due to the deterrent effect of law enforcement, where if people believe they are more likely to be caught and punished for a crime, they might be less likely to commit one.
The study does acknowledge some limitations. The spatial resolution of the VIIRS satellite data can only resolve upto a 1 km by 1 km grid cel, potentially obscuring inequality in dense, mixed-income areas. The researchers also noted that while they found a link between overall conviction rates and crime, they couldn't analyse conviction rates for specific types of crime due to data limitations. This could also explain why conviction rates didn't show a statistically significant impact on violent or property crimes specifically in their analysis. They also considered the impact of the COVID-19 pandemic, finding that while the lockdown period was included in their data, it didn't have a statistically significant impact on the overall crime rates in their model.
The innovative and novel use of satellite data to measure economic inequality, especially in places where traditional data is scarce, allowed the researchers to get an economic snapshots of areas and their evolution over time. The method allows for policymakers and urban planners to quickly understand the link between inequality and crime and its geographical spread. Strategies can be tailored to reducing economic disparities within cities, like promoting more uniform development, ensuring equal access to education and resources, to make our cities safer. The method developed could also be extended to make other economic and social assessments of a region, giving us a a new way to keep track of the growth of our cities.
This article was written with the help of generative AI and edited by an editor at Research Matters.
