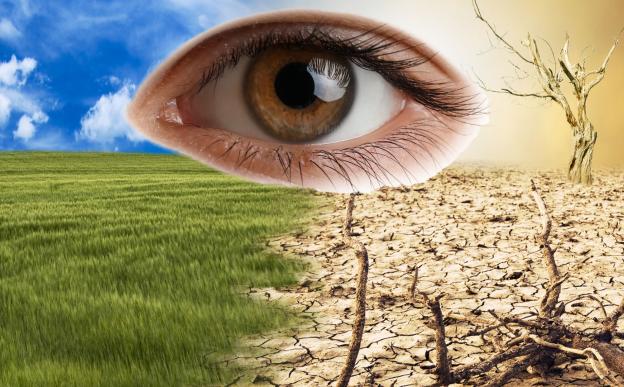
Global warming has triggered a range of climatic changes in regions worldwide. While some areas struggle with raging storms and torrential rains, others have been hit by drought and desertification, turning them into barren wastelands. India has also been facing these extreme weather events, particularly in the state of Rajasthan in western India, which is particularly vulnerable, making it a crucial battleground in the global fight against land degradation.
Recently, a team of researchers from Birla Institute of Technology, Ranchi, set out to understand and map the threat of desertification across the entire state of Rajasthan. The team developed an analytical framework called the Environmentally Sensitive Area (ESA) Index, which integrates four key components: Soil Quality, Vegetation Quality, Climate Quality, and Socio-economic Quality. To build these indices, they examined 15 different indicators, including rainfall, soil texture, vegetation cover, population density, and literacy rate.
Did You Know? The Thar Desert covers an area of 200,000 square kilometres in India and Pakistan and is the world's 18th-largest desert. |
Next, the researchers used a technique called the Analytical Hierarchy Process (AHP) to assign weights or levels of importance to each of these indicators and the four leading quality indices. This helped them understand which factors had the most significant impact on desertification. For example, within the Soil Quality Index, soil texture and slope gradient were identified as the most influential factors.
To gather all the necessary ingredients for their analysis, they relied heavily on Earth Observation (EO) satellite data and Geographic Information Systems (GIS). Satellite data provided information on factors like land use, land cover, and vegetation health. Digital Elevation Models (DEMs) helped them understand the terrain and slope. Climate data, including rainfall, temperature, and wind speed, was also collected. For socio-economic factors, they utilised census data to understand population density, growth rates, literacy rates, and work participation rates. The diverse data, initially at different resolutions, were processed and resampled to a common resolution of 300 meters to ensure compatibility.
Their study revealed that a significant portion of Rajasthan is teetering on the edge, with nearly 20.53% of the state's land classified as being moderately vulnerable to desertification. The region might get completely covered by the desert if current practices continue. Even more concerning is the fact that 11.67% falls under high vulnerability, and 6.65% is experiencing very high desertification vulnerability. These highly vulnerable areas are predominantly found in the southern and eastern parts of Rajasthan, where a combination of intense human pressures and extreme climatic conditions exacerbates the problem.
The researchers also pinpointed the most influential factors driving this degradation. The Soil Quality Index (SQI) is the biggest culprit, having the highest impact on desertification vulnerability. Healthy soil is the foundation of any thriving ecosystem. Degradation of the soil can collapse the entire ecosystem like a house of cards. Following soil quality, the Vegetation Quality Index (VQI) and Climate Quality Index (CQI) play significant roles, while the Socio-economic Quality Index (SEQI) also contributes, albeit to a lesser extent. Human activities, reflected in the socio-economic factors, add another layer of pressure.
This study offers a comprehensive assessment of the entire state of Rajasthan. By integrating a broader range of climatic and socioeconomic parameters, this research provides a more comprehensive picture of desertification dynamics. The use of AHP and cloud computing also enhances the accuracy and efficiency of the assessment. However, the researchers acknowledge they didn't perform a multicollinearity assessment to check if some of their 15 indicators were too similar or redundant. Additionally, they didn't include surface water indices, such as the Normalised Difference Water Index (NDWI). Finally, their reliance on 2011 census data for socio-economic factors means this information is now somewhat outdated.
Despite these limitations, this research clearly identifies areas most vulnerable to desertification. It helps provide an early warning system for policymakers and local communities. This information is vital for developing sustainable land management strategies and regional planning to combat desertification. The findings directly inform existing policy frameworks, such as the Rajasthan State Action Plan on Climate Change and the National Action Programme to Combat Desertification, enabling them to target interventions more effectively.
This article was written with the help of generative AI and edited by an editor at Research Matters.


